Professional Stock Chart
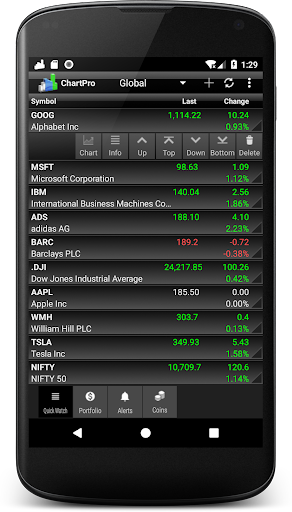
Professional interactive stock chart with portfolio tracking option.


Rating: 3.89
(5,739)
Permissions:
- android.permission.ACCESS_ADSERVICES_AD_ID
- android.permission.ACCESS_ADSERVICES_ATTRIBUTION
- android.permission.ACCESS_ADSERVICES_TOPICS
- android.permission.ACCESS_NETWORK_STATE
- android.permission.FOREGROUND_SERVICE
- android.permission.INTERNET
- android.permission.POST_NOTIFICATIONS
- android.permission.READ_EXTERNAL_STORAGE
- android.permission.RECEIVE_BOOT_COMPLETED
- android.permission.WRITE_EXTERNAL_STORAGE See more
Size: 8.18M
Email: of*****@prostockchart.com
URLs: Website ,Privacy policy
Full description: See detailed description
Source: Google Play Store
Updated: a day ago
Ranking
User reviews
Pros
- Reliable and highly recommended by long-term users
- Great charting capabilities with multiple indicators
- User-friendly interface and ease of use
- Allows for different templates for different stocks
- Good visual quality of charts
Cons
- Loud video ads that play automatically and cannot be muted
- Frequent bugs and issues with data accuracy and fetching
- Limited support and customer service issues
- Problems with saving templates and losing watch lists
- Inconsistent performance with charting and timeframes
Most mentioned
- Audio ads that auto-play at full volume
- Issues with data accuracy related to volume
- Problems with app freezing and missing features after updates
- Desire for more customization options for indicators and timeframes
- Bugs related to saving templates and losing data
These summaries are automatically generated weekly using AI based on recent user reviews. User
reviews may be inaccurate, spammy, or outdated.
User reviews
Problem with daily-to-weekly switching and back again.Explained in email.Please fix this issue.Also,add black option in indicators color-selection
by  A google user, 2025-01-04
Great app, i use it every day for analysis. Thank to you that you had fix it.
by  Ima Yusaman, 2024-12-23
Similar apps
Here are some Android apps that are similar to Professional Stock Chart: